Warning: Declaration of My_Walker::start_el(&$output, $item, $depth, $args) should be compatible with Walker_Nav_Menu::start_el(&$output, $data_object, $depth = 0, $args = NULL, $current_object_id = 0) in /home2/ajnrblog/public_html/ajnrdigest/wp-content/themes/ajnr/functions.php on line 258
Susceptibility-Weighted Imaging in the Evaluation of Cerebrovascular Hemodynamics - AJNR News Digest
May 2015
Introduction

Susceptibility-Weighted Imaging in the Evaluation of Cerebrovascular Hemodynamics

Guest Editor Carlos Zamora

Guest Editor
Carlos Zamora

Susceptibility-weighted imaging (SWI) is a high-resolution, fully velocity-compensated gradient-echo MRI sequence that maximizes intrinsic contrast differences between tissues by virtue of their local magnetic properties. This technique exploits susceptibility information contained within phase acquisitions and merges such with magnitude data to generate a clinically usable set of images. Notably, the functional incorporation of phase data in a clinical sequence was initially challenging and warranted improvements in MRI technology that eventually culminated in the development of SWI. The entire sequence requires no more than a few minutes of scanning time and can be effectively applied in a clinical setting.

SWI has proven to be highly sensitive for the detection of paramagnetic and diamagnetic substances such as hemosiderin, ferritin, calcium, and deoxyhemoglobin, which has resulted in a number of research and clinical applications being advocated. There has also been a growing interest in taking advantage of the enhanced sensitivity and resolution provided by ultra-high-field scanners for both functional and microstructural applications.1–3 Over the past several years, SWI has gained relatively wide clinical acceptance, and many potential diverse uses have been proposed in the literature, including in trauma,4 aging and neurodegenerative disorders,1,5–7 demyelination,8 and stroke,9–11 among others. In general, at least in the clinical setting, SWI seems to be most popular by virtue of its exquisite sensitivity for the detection of small amounts of blood products that may otherwise be subtle, or even invisible. However, in addition to structural abnormalities, hemodynamic information can be derived visually and with techniques such as quantitative susceptibility mapping, which can provide measures of oxygen extraction.12,13

SWI was originally introduced as a means for intrinsic MR venography based on signal changes in response to deoxyhemoglobin.14 Studies have shown that SWI can provide good visual representation of cerebral veins and new techniques may even be able to consistently remove air/tissue interface artifacts in the future. However, beyond the demonstration of venous morphology, relative changes in signal intensity provide an additional level of functional information by reflecting oxygen metabolism. Deoxyhemoglobin exerts a strong influence on SWI signal due to its paramagnetic properties, and this feature is exploited as a marker of cerebral hemodynamics. Cortical draining veins will vary their signal as a function of perfusion status and variations in oxygen extraction, wherein draining veins in hypoperfused tissue will have lower signal and artifactually appear more prominent, and vice versa. As the use of SWI has become more generalized, my own awareness of this additional layer of hemodynamic information has also increased. For instance, aside from expected changes in cases of stroke, I more frequently see patients where perfusion abnormalities were present and sometimes unsuspected, which may be particularly helpful when the initial clinical picture is not entirely clear. Examples of such cases may include postictal states, migraines, and various causes of vasospasm.

While an attractive feature of SWI is the ability to visually derive hemodynamic information, many studies have proposed quantification of signal changes, which may make analysis more reproducible. A similar sequence, susceptibility-weighted angiography (SWAN, based on magnitude but not phase information) was able to differentiate normoxemic from hypoxemic veins both visually and through quantification of voxel intensities.15 Such properties are particularly appealing in the evaluation of stroke. In fact, blood oxygen level-dependent sequences, including SWI, have been proposed as an alternative (and possibly more accurate) means for determining tissue at risk based on oxygen metabolism.16-18 If these uses can be clinically validated, they would provide a significant added benefit by not requiring intravenous contrast material. They also have much higher spatial resolution than arterial spin-labeling, the only noncontrast MRI perfusion sequence in routine clinical use today.

The current issue of AJNR Digest focuses on the added value of SWI as a marker of cerebrovascular hemodynamics and vasomotor reactivity. The first two review articles come from the same group that developed SWI.19,20 In part 1, they carefully expose the technical aspects on which the sequence is based, recommend imaging parameters for different field strengths, and examine concepts that are essential for optimal clinical interpretation.19 Part 2 explores various clinical applications, including the evaluation of cerebrovascular and perfusion abnormalities.20

The paper by Chang et al21 highlights the sensitivity of SWI to venous oxygenation by demonstrating visual and quantifiable perfusion changes in healthy volunteers during apnea and hyperventilation, in response to CO2 as a vasoactive modulator.
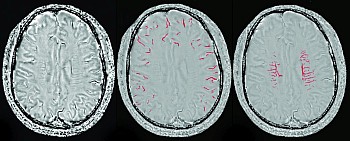
In a separate study, Bosemani et al11 evaluated 24 children with ischemic stroke using semiquantitative analysis of venous signal intensity. They defined a mismatch between areas of low SWI signal intensity and restricted diffusion on DTI and showed a statistically significant association with stroke progression on follow-up imaging.

In the last article, Chen and Sun et al10 propose the use of an SWI-DWI mismatch in patients with acute ischemic stroke. They determined this by quantifying venous voxel counts after segmentation of venous structures and devising an “asymmetry index” as the ratio between the ischemic tissue and the normally perfused contralateral brain. They found that SWI-DWI mismatch was independently and significantly associated with an increased rate of favorable outcomes following thrombolysis, with a higher accuracy than PWI-DWI mismatch.

References

  1. Nakada T, Matsuzawa H, Igarashi H, et al. Expansion of corticomedullary junction high-susceptibility region (CMJ-HSR) with aging: a clue in the pathogenesis of Alzheimer's disease? J Neuroimaging 2012;22:379–83, 10.1111/j.1552-6569.2011.00607.x
  2. Nakada T, Matsuzawa H, Igarashi H, et al. In vivo visualization of senile-plaque-like pathology in Alzheimer's disease patients by MR microscopy on a 7T system. J Neuroimaging 2008;18:125–29, 10.1111/j.1552-6569.2007.00179.x
  3. Goodwin JA, Kudo K, Shinohe Y, et al. Susceptibility-weighted phase imaging and oxygen extraction fraction measurement during sedation and sedation recovery using 7T MRI. J Neuroimaging 2014, 10.1111/jon.12192
  4. Liu J, Xia S, Hanks RA, et al. Susceptibility weighted imaging and mapping of micro-hemorrhages and major deep veins after traumatic brain injury. J Neurotrauma 2015, 10.1089/neu.2014.3856
  5. Meijer FJ, van Rumund A, Fasen BA, et al. Susceptibility-weighted imaging improves the diagnostic accuracy of 3T brain MRI in the work-up of Parkinsonism. AJNR Am J Neuroradiol 2014, 10.3174/ajnr.A4140
  6. Schwarz ST, Abaei M, Gontu V, et al. Diffusion tensor imaging of nigral degeneration in Parkinson's disease: A region-of-interest and voxel-based study at 3 T and systematic review with meta-analysis. Neuroimage Clin 2013;3:481–88, 10.1016/j.nicl.2013.10.006
  7. Yates PA, Sirisriro R, Villemagne VL, et al. Cerebral microhemorrhage and brain beta-amyloid in aging and Alzheimer disease. Neurology 2011;77:48–54, 10.1212/WNL.0b013e318221ad36
  8. Modica CM, Zivadinov R, Dwyer MG, et al. Iron and volume in the deep gray matter: association with cognitive impairment in multiple sclerosis. AJNR Am J Neuroradiol 2015;36:57–62, 10.3174/ajnr.A3998
  9. Luo S, Yang L, Wang L. Comparison of susceptibility-weighted and perfusion-weighted magnetic resonance imaging in the detection of penumbra in acute ischemic stroke. J Neuroradiol 2014
  10. Lou M, Chen Z, Wan J, et al. Susceptibility-diffusion mismatch predicts thrombolytic outcomes: a retrospective cohort study. AJNR Am J Neuroradiol 2014;35:2061–67, 10.3174/ajnr.A4017
  11. Polan RM, Poretti A, Huisman TA, et al. Susceptibility-weighted imaging in pediatric arterial ischemic stroke: a valuable alternative for the noninvasive evaluation of altered cerebral hemodynamics. AJNR Am J Neuroradiol 2014, 10.3174/ajnr.A4187
  12. Haacke EM, Liu S, Buch S, et al. Quantitative susceptibility mapping: current status and future directions. Magn Reson Imaging 2015;33:1–25, 10.1016/j.mri.2014.09.004
  13. Tang J, Liu S, Neelavalli J, et al. Improving susceptibility mapping using a threshold-based K-space/image domain iterative reconstruction approach. Magn Reson Med 2013;69:1396–1407, 10.1002/mrm.24384
  14. Reichenbach JR, Venkatesan R, Schillinger DJ, et al. Small vessels in the human brain: MR venography with deoxyhemoglobin as an intrinsic contrast agent. Radiology 1997;204:272–77, 10.1148/radiology.204.1.9205259
  15. Patzig M, Feddersen B, Haegler K, et al. Susceptibility-weighted angiography visualizes hypoxia in cerebral veins. Invest Radiol 2015
  16. Geisler BS, Brandhoff F, Fiehler J, et al. Blood-oxygen-level-dependent MRI allows metabolic description of tissue at risk in acute stroke patients. Stroke 2006;37:1778–84, 10.1161/01.STR.0000226738.97426.6f
  17. Hermier M, Nighoghossian N. Contribution of susceptibility-weighted imaging to acute stroke assessment. Stroke 2004;35:1989–94, 10.1161/01.STR.0000133341.74387.96
  18. Morita N, Harada M, Uno M, et al. Ischemic findings of T2*-weighted 3-Tesla MRI in acute stroke patients. Cerebrovasc Dis 2008;26:367–75
  19. Haacke EM, Mittal S, Wu Z, et al. Susceptibility-weighted imaging: technical aspects and clinical applications, part 1. AJNR Am J Neuroradiol 2009;30:19–30, 10.3174/ajnr.A1400
  20. Mittal S, Wu Z, Neelavalli J, et al. Susceptibility-weighted imaging: technical aspects and clinical applications, part 2. AJNR Am J Neuroradiol 2009;30:232–52, 10.3174/ajnr.A1461
  21. Chang K, Barnes S, Haacke EM, et al. Imaging the effects of oxygen saturation changes in voluntary apnea and hyperventilation on susceptibility-weighted imaging. AJNR Am J Neuroradiol 2014;35:1091–95, 10.3174/ajnr.A3818


Image modified from:Lou M, Chen Z, Wang J, et al. Susceptibility-diffusion mismatch predicts thrombolytic outcomes: a retrospective cohort study.